


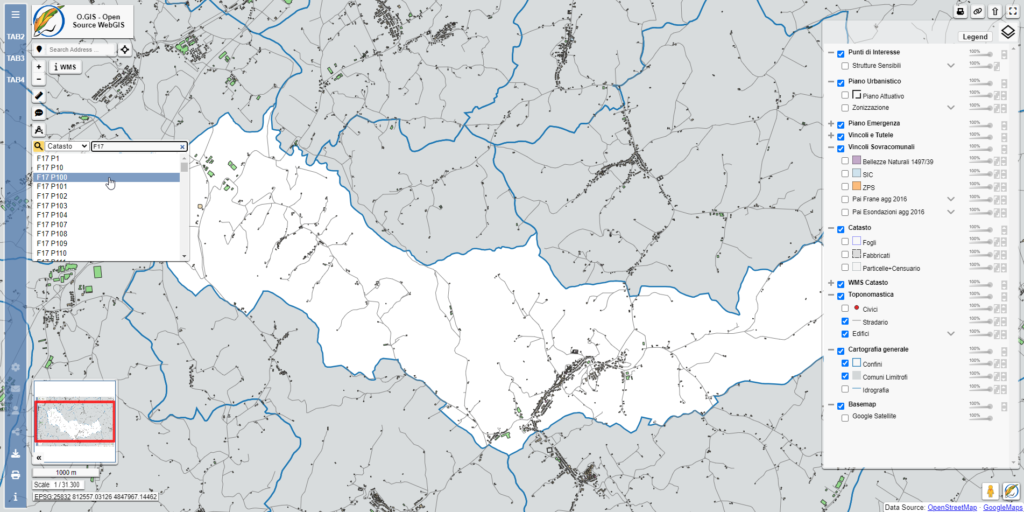
Final map – after configuration #
One-off or permanent setups #
The configurations in this guide can be set in the individual project after export or in the plugin provided, so that all subsequent exports maintain the configurations
One-off setups #
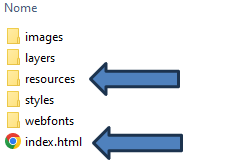
Navigate to the folder where the QGIS project was exported and make changes in the index.html file and the resources folder
Permanent setups #
Attention! Permanent changes will affect every export and will be overwritten if the plugin is updated, please make a backup of every change
The same changes described for one-off configurations can be made permanently, which will therefore have an effect on every export, directly in the QGIS plugins folder at the path
C:\Users\User\AppData\Roaming\QGIS\QGIS3\profiles\default\python\plugins
The resources folder will be present
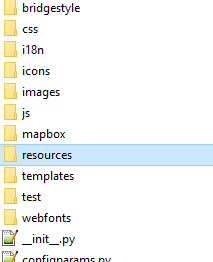
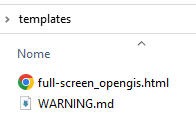
Instead of the index.html file you need to edit full-screen_o.gis.html
Logo #
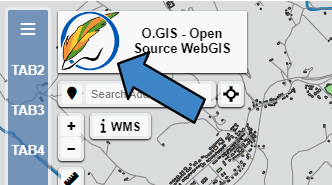
Edit the logo by replacing the stemma.png file with your logo image. I recommend maximum dimensions 120x120px
Sidebar tabs #
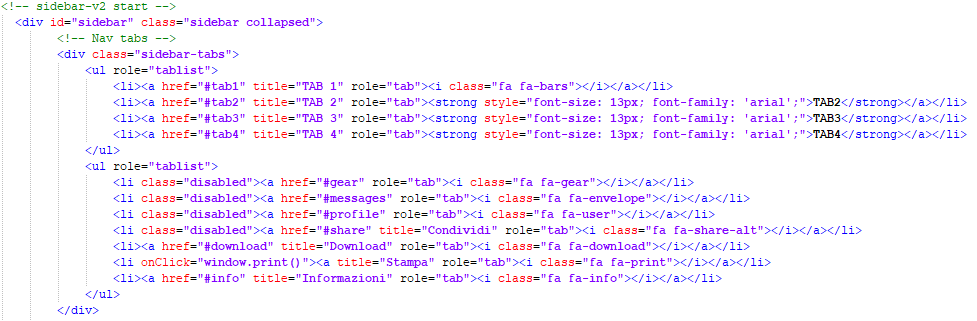
Edit the one-off or permanent setup html file
by defining your tablist, the first will be anchored at the top, the second at the bottom. In the example you can see how to use font-awesome (for example fa fa-gear to make a settings icon appear) or use standard text. It is also possible to insert deactivated tablists.
By defining href it is possible to click to open the tab or enter a web address to reach it when clicked. You can customize the buttons to your liking, I’ll also leave you an example to launch a printout of the browser screen.
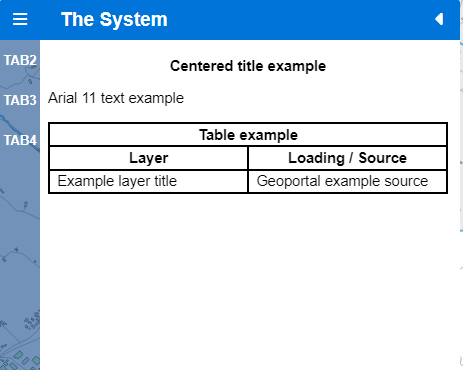
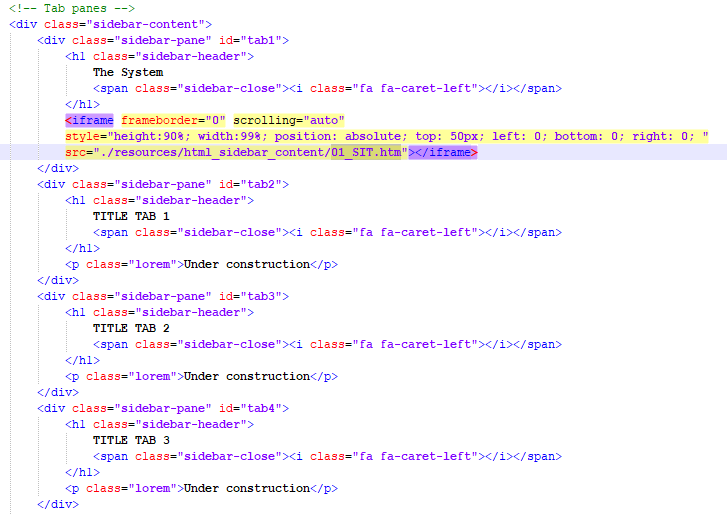
The content of the sidebar can be defined either directly in the one-off or permanent setup html file or by placing the html files to be shown in the resources > html_sidebar_content folder.
Remember: you can write text, images, tables etc. in a plain text file (such as with Word or Libre Office) and then save it in html.
Below you can see that the content of TAB1 was not written by hand, but the 01_SIT.htm file located in the dedicated folder is recalled
Measurement #
By default the measurement tool shows the dimensions in metric units, if you need imperial units edit the o.gis.js file contained in resources>o.gis folder
Edit the one-off or permanent setup html file
Imperial code:
function convertToFeet(length) {
	feet_length = length * 3.2808;
	return feet_length
}

/**
 * format circle output
 * @param {ol.geom.Circle} line
 * @return {string}
 */
var formatCircle = function (circle) {
	var radius;
	var firstclick = circle.getFirstCoordinate();
	var secondclick = circle.getLastCoordinate();
	radius = 0;
	var sourceProj = map.getView().getProjection();
	var adjustfirstclick = ol.proj.transform(firstclick, sourceProj, "EPSG:4326");
	var adjustsecondclick = ol.proj.transform(secondclick, sourceProj, "EPSG:4326");
	radius += ol.sphere.getDistance(adjustfirstclick, adjustsecondclick);
	feet_radius = convertToFeet(radius)
	var output;
	if (feet_radius > 5280) {
		output =
			"(r)" + " " + (Math.round(feet_radius / 5280 * 100) / 100) + " miles";
	} else {
		output = "(r)" + " " + (Math.round(feet_radius * 100) / 100) + " ft";
	}
	return output;
};

/**
 * format length output
 * @param {ol.geom.LineString} line
 * @return {string}
 */
var formatLength = function (line) {
	var length;
	var coordinates = line.getCoordinates();
	length = 0;
	var sourceProj = map.getView().getProjection();
	for (var i = 0, ii = coordinates.length - 1; i < ii; ++i) {
		var c1 = ol.proj.transform(coordinates[i], sourceProj, 'EPSG:4326');
		var c2 = ol.proj.transform(coordinates[i + 1], sourceProj, 'EPSG:4326');
		length += ol.sphere.getDistance(c1, c2);
	}
	feet_length = convertToFeet(length)
	var output;
	if (feet_length > 5280) {
		output = (Math.round(feet_length / 5280 * 100) / 100) + ' miles';
	} else {
		output = (Math.round(feet_length * 100) / 100) + ' ft';
	}
	return output;
};

/**
 * Format area output.
 * @param {ol.geom.Polygon} polygon The polygon.
 * @return {string} Formatted area.
 */
var formatArea = function (polygon) {
	var area = polygon.getArea();
	var output;
	if (area > 107639) { // Converte 1 km^2 in piedi quadrati
		output = (Math.round((area / 107639) * 1000) / 1000) + ' sq mi';
	} else {
		output = (Math.round(area * 10.7639 * 100) / 100) + ' sq ft';
	}
	return output;
};
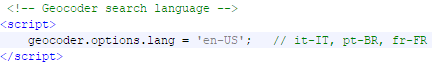
Geocoder #
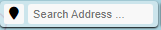
Edit the one-off or permanent setup html file
By default the address search via geocoder is set to the 'en-US' language, you can change the search language as you wish by modifying the example code in the html file
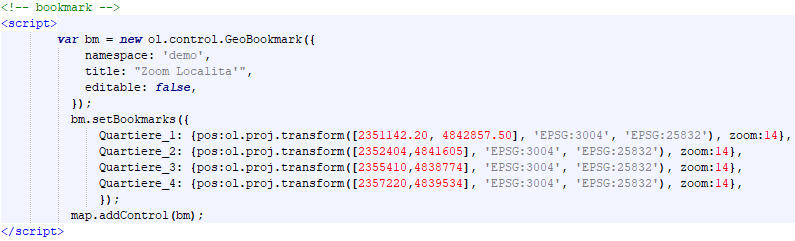
Bookmarks #
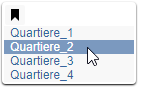
Edit the one-off or permanent setup html file
You can define your bookmarks by modifying the example code you find. Define the title and x,y coordinates of the point where you will have to zoom when clicking. Also define a possible transformation, for example if you are entering coordinates in epsg3004 but the map has base coordinates in epsg25832 you can transform them on the fly. Finally, define the zoom at the point (depends on the width of your map).
Quick search #
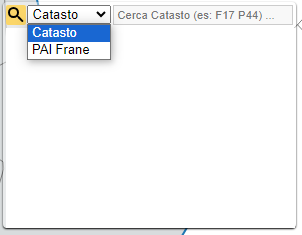
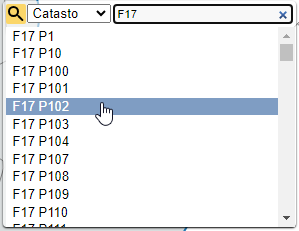
Edit the one-off or permanent setup html file
You can define one or more options for the search and for each one you will have to set the Source (the json that contains the data), the name of the field in which to search for the data, the placeholder (you can use it as a search suggestion) and finally you can do something as soon as you click on a found field. (in the example I turn on the level)

Overview map – minimap #
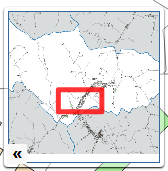
Edit the one-off or permanent setup html file
By default the minimap is set with the OSM (OpenStreetMap) background, you can change this choice using the examples you find in the html file, which I report:
<!-- overview map -->
<script>
var MaxMapExtent = map.getView().getProperties().extent;
var ov = new ol.control.Overview({
layers: [
new ol.layer.Tile({
source: new ol.source.OSM()
}),
],
// google satellite example
/* layers: [
new ol.layer.Tile({
source: new ol.source.XYZ({
url: 'https://mt1.google.com/vt/lyrs=s&x={x}&y={y}&z={z}'
})
}),
], */
// opentopo example
/* layers: [
new ol.layer.Tile({
source: new ol.source.XYZ({
url: 'https://tile.opentopomap.org/{z}/{x}/{y}.png'
})
}),
], */
//static image example, set also minZoom and maxZoom
/* layers: [
new ol.layer.Image({
source: new ol.source.ImageStatic({
url: './resources/minimap.png',
imageExtent: MaxMapExtent,
})
})
], */
//projection: 'EPSG:25832',
//minZoom: '10.5',
//maxZoom: '12',
rotation: true,
align: 'bottom-left',
//panAnimation: "elastic"
});
map.addControl(ov);
// Select button
var overviewbuttontitle = $('div.ol-overview button');
// Set button title
overviewbuttontitle.attr('title', 'Minimap');
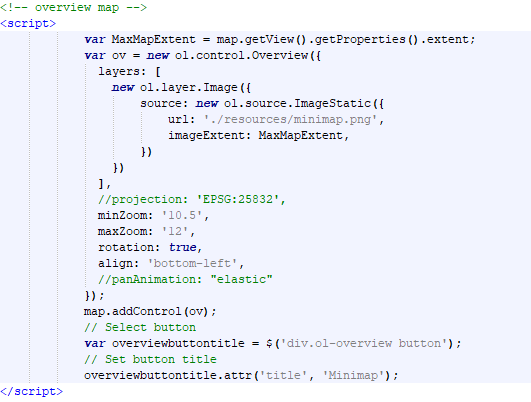
</script>If you want to set a static image replace the minimap.png file in the resources folder with your own. I recommend opening the map in extended view, reducing the layerswitcher and performing a maximum screen of the map.
The mini map is defined in this part of the example code, in this case you will have to set minZoom and maxZoom
Permalink #
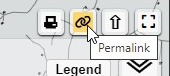
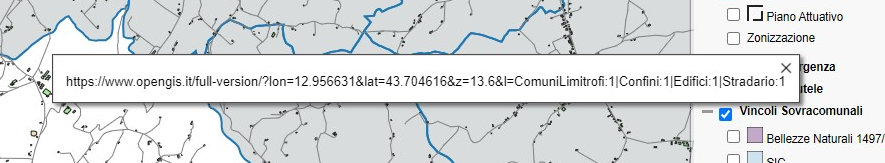
The permalink functionality allows the link in the browser address bar to be constantly updated based on the portion of the map displayed and its zoom, furthermore the activated layers are stored. In this way it is possible to share the link with other users to view the exact map you are viewing.
It is therefore possible to define many different links to open the map with specific layers turned on.
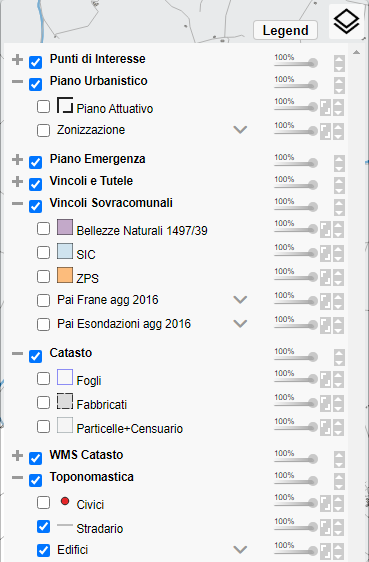
Layerswitcher #
Edit the one-off or permanent setup html file
Group layers #
for plugin versions before v.2.19.0
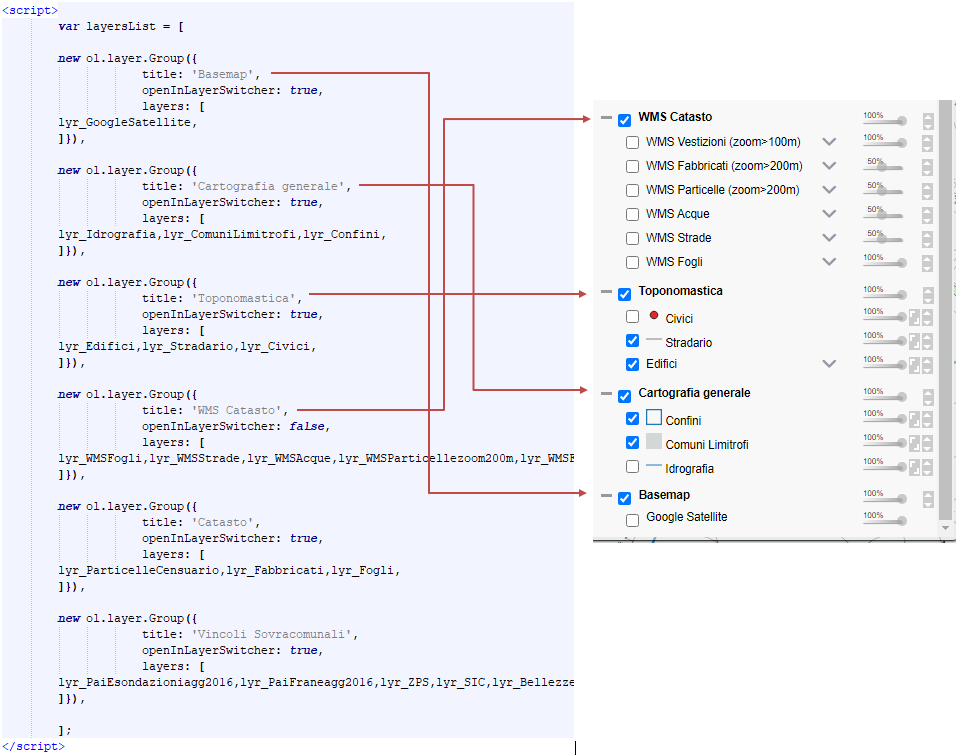
In the layers.js file of the “layers” folder the plugin exports and configures each layer present in the QGIS project. Once this configuration is finished there is the definition of the layersList variable
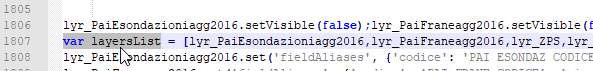
This variable is recalled from the map therefore defining it in a personalized way is essential for grouping the layers.
Do not manually edit the layers.js file, but define the variable again in your html file (where you will find an example).
Warning: each layer present in the
layersListvariable inlayers.jsmust also be inserted in the new variableAttention: in qgis2o.gis the default functionality of final progressive naming of the layers has been deactivated. Therefore the Civic layers and the Buildings layer, which in qgis2web acquire the name lyr_Civic_1 and lyr_Buildings_2, in qgis2o.gis receive lyr_Civic and lyr_Buildings. This means that there must not be two layers with the same name in the QGIS project, but it also means that any changes made after export, such as layer grouping, can easily be used for subsequent exports, because the layers do not change names on the basis of the order.
The group structure must have the reverse ordering of what you want to show in the layerswitcher
Example:
Since version v2.19.0 of the plugin layer groups are supported by default, so you can group layers in QGIS and export.
Warning: Nested groups are not supported.
If you need to nest groups, see the guide for versions prior to v2.19.0 described above
Base Layers #
Edit the one-off or permanent setup html file
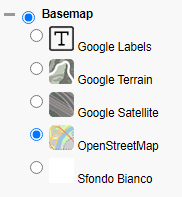
By default, layers are defined as baseLayer = false, so they can be turned on at the same time as others. To provide a unique alternative you need to define baseLayer in this way,
baseLayer = false (two layers turned on at the same time)
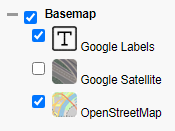
baseLayer = true (only one layer turned on)
To set a layer as baseLayer, write the following code after layers.js definition
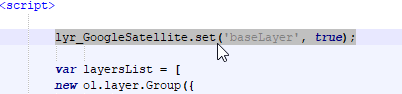
lyr_GoogleSatellite.set('baseLayer', true);
Warning: for the example I used background layers, however some realtime web services do not allow you to overlay your maps on maps of another nature. So it’s a good idea to get informed and set these levels as
baseLayer = true
It is also a good idea to insert a White base layer to deactivate the others, you can do it with this code before the layersList and obviously insert the layer in the layersList
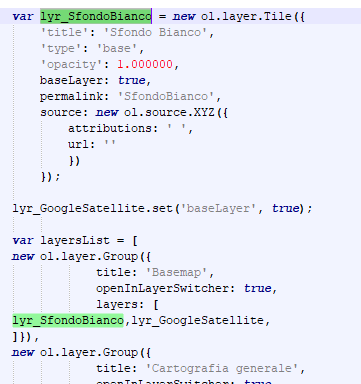
var lyr_SfondoBianco = new ol.layer.Tile({
'title': 'Sfondo Bianco',
'type': 'base',
'opacity': 1.000000,
baseLayer: true,
permalink: 'SfondoBianco',
source: new ol.source.XYZ({
attributions: ' ',
url: ''
})
});
Width #
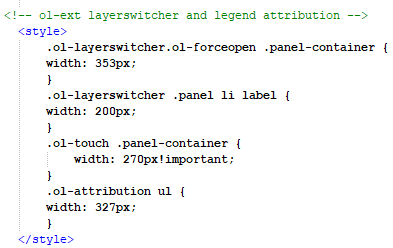
Edit the one-off or permanent setup html file
To change the width of the layerswitcher act in the html file in this part. You will have to change the width of the panel, of the labels, of the panel on touch devices and remember to also change the width of the Legend (visible by clicking the button above)
Layers tools #
Opacity bar #
Edit the one-off or permanent setup html file
Each layer is equipped with an opacity bar that allows you to manage the transparency of the geometries on the map. It is possible to deactivate the Opacity bar for individual layers by editing the html file as in this example: lyr_GoogleLabels.set('noOpacity', true);
If you want to completely disable this functionality you will have to edit the html file before closing </body>
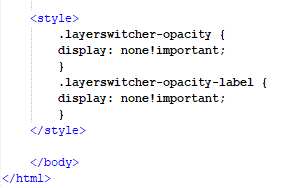
.layerswitcher-opacity {
display: none!important;
}
.layerswitcher-opacity-label {
display: none!important;
}
Zoom extension #
Edit the one-off or permanent setup html file
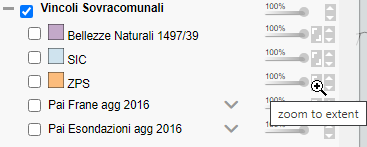
By default all vector layers acquire the “extent” property which causes the button to zoom to the extent of the layer to appear.
If you want to disable this functionality, disable the extent property by editing the html file as in this example: lyr_PaiEsondazioniagg2016.set('extent' , '');
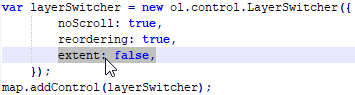
If you want to completely disable this functionality you will have to edit the resources\o.gis\o.gis.js file and set false to extent
Move layer #
Edit the one-off or permanent setup html file
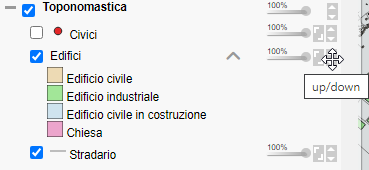
The layers are drawn on the map in the reading order of the layersList but it is possible to reposition them with the appropriate button.
You can move individual layers or entire layer groups as you wish. When you reload the map the layers will return to the order defined in the layersList variable
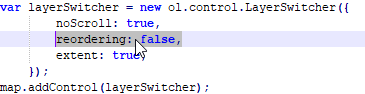
If you want to completely disable this functionality you will have to edit the resources\o.gis\o.gis.js file and set false to reordering
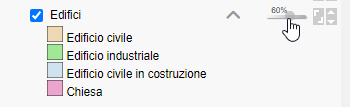
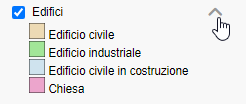
Legend #
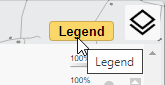
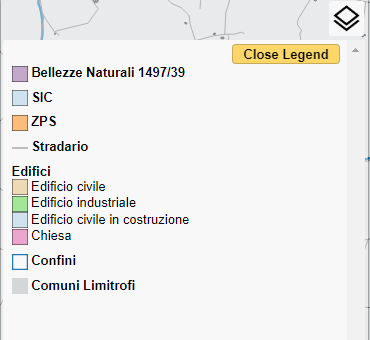
The Legend button will show the symbols of all the layers visible on the map. Alternatively, it is possible to extend/reduce the symbology of a single layer directly from the layerswitcher main screen by clicking the arrow
Open/closed desktop/smartphone #
Edit the one-off or permanent setup html file
By default the layerswitcher is set to appear open on desktop PCs and closed on smartphones.
If you want to change this option and have the layerswitcher always open or always closed you can use the following code. It must be inserted before closing </body> of the html file
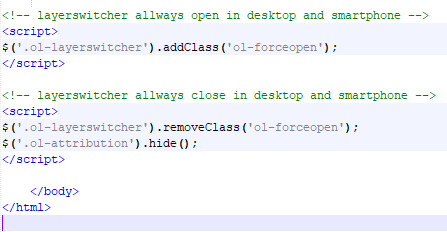
$('.ol-layerswitcher').addClass('ol-forceopen');
$('.ol-layerswitcher').removeClass('ol-forceopen');
$('.ol-attribution').hide();
Mouse position coordinates #
Edit the one-off or permanent setup html file
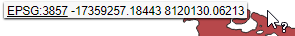
When moving the mouse on the map, the coordinate relating to the position in the EPSG 3857 Reference System will be shown.
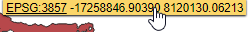
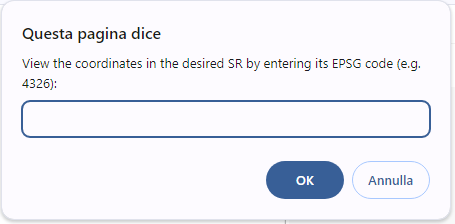
On the fly, to view the coordinates in other Reference Systems click on the button and change it by entering a new epsg code
o change the coordinates shown by default there are 2 possibilities:
- Change the reference system of your QGIS project and export the map by selecting

- Leave your QGIS reference system intact but change the EPSG shown by editing
htmlfile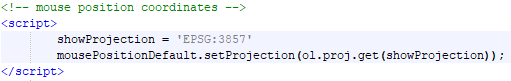
Google Streetview #
The streetview functionality is active by default without Google apiKey and will appear like this

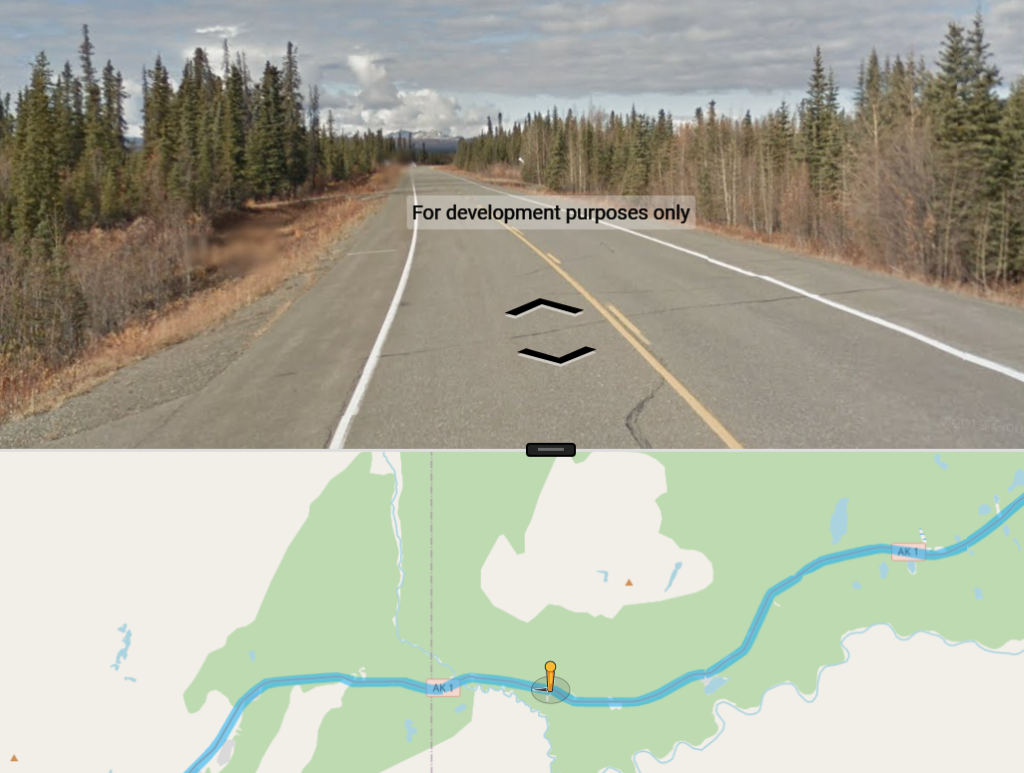
If you want to remove “for developmente purpose only” you can request your apiKey from Google and insert it into the html file
Edit the one-off or permanent setup html file

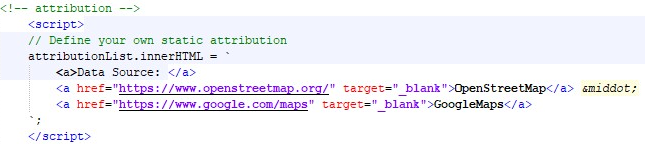
Attributions #

Edit the one-off or permanent setup html file
Attributions are shown in the bottom right.
To modify them you need to edit the html file in this part
Remove controls #
Edit the one-off or permanent setup html file
To remove the controls present in the map you can use the following strings, to be written in the .html file before closing the </body>, uncomment the beginning of the single line to remove the chosen control.
<!-- remove control -->
<script>
	// map.removeControl(geocoder);			// remove address search
	// map.removeControl(geoloc);			// remove gps loc
	// map.removeControl(querywmswfs);		// remove query wms
	// map.removeControl(popupall);			// remove popup all
	// map.removeControl(bar);			// remove design bar
	// map.removeControl(search); 			// remove quick search
	// map.removeControl(scaleCtrl);		// remove scale control
	// map.removeControl(mousePositionDefault);     // remove mouse position
	// map.removeControl(printControl);		// remove print
</script>

<style>
	/* .ol-zoom {display: none!important;}				/* remove zoom */
	/* .measure-control {display: none!important;}			/* remove measure */
	/*.ol-scale-line {display: none!important;}			/* remove scale line */
	/* .ol-permalink {display: none!important;}			/* remove permalink */
	/* .ol-rotate {display: none!important;}			/* remove rotate */
	/* .expand {display: none!important;}				/* remove full screen */
	/* .legend-attribution {display: none!important;}		/* remove legend */
	/* .layerswitcher-opacity, .layerswitcher-opacity-label {	/* remove layers opacity */
		display: none!important;}
	/* .layerExtent {display: none!important;}			/* remove layers extent */
	/* .layerup {display: none!important;}				/* remove layers move */
	/* #ol-street-view--pegman-button-div {				/* remove street view */
		display: none!important;}
</style>